Did you know that there are 40 possible point distributions for a group at the first round of the World Cup? I was wondering how many there are and with what probability they occur. So here are the results of my calculations: There are 729 (3^6) variations of the results of the six matches of the group stage, ignoring the actually scored goals and only considering if the first mentionend team wins, draws or loses.
By ordering the resulting point distribution by the number of points, the results can be reduced to 40 combinations, where the first digit belongs to the first placed team, the second to the second placed etc. There is only one variation, a streak of six consecutive draws, which leads to a point distribution with three points for every team (3333). On the other side, there are 36 possible sequences of match results that lead to the distributions 6443 and 7441.
But which point distributions have the highest probability? Well, that depends on the probability of match outcome. If a victory, a loss and a draw have the same probability, it can be calculated by simply dividing the number of variations for a certain distribution by the number of all possible variations. In case of 6443 this would be 36/729 or 4.94 percent. The assumption that all results occur with the same frequency in very unlikely. To calculate „empirical“ probabilities, I looked at the last five World Cups and counted the number of draws in the first round. 63 of 240 matches ended without a winner. Thus, the draw probability for any match, not having any further information on the competitors, is 26.25 percent. For further calculation, I simply assumed that both teams have an equal winning probability of (1-0,2625)/2.
Take a look at the results:
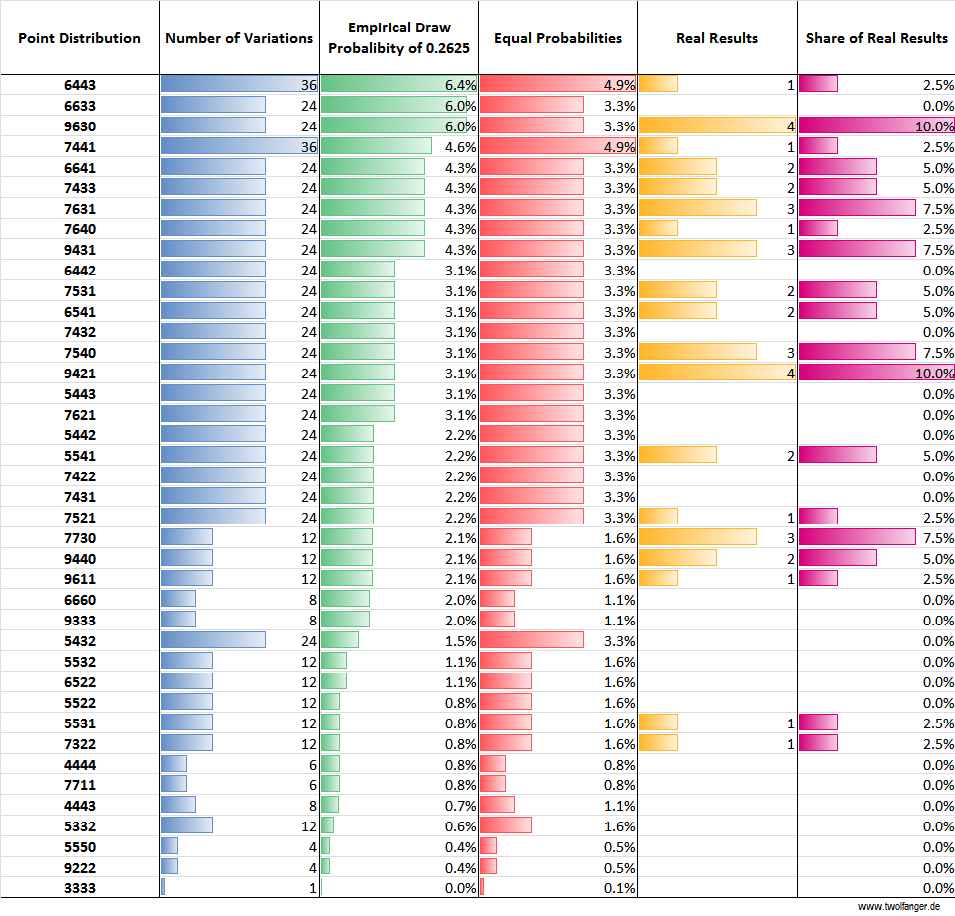
Number of Variations, Probabilities and Real Point Distributions (1998 to 2014) for World Cup Group Stage
Obviously the point distributions with a higher calculated empirical probability occur indeed more often. Having only included 40 groups since 1998, the distribution lacks of course some smoothness. But there probably is a problem with the assumption of equal winning probabilities too. Since 1998 the two combinations with the highest computed probabilities have only occured once or in 2.5 percent of the included groups, although they should have in 12.4 percent. A reasonable explanation is, that team strength plays a crucial rule in the creation of groups. The highest ranking teams in the FIFA are distributed over all groups, making it likely that their winning probability in every match is higher than assumend for my calculations. Point distributions like 6633 and 6443 are more likely to occur if a group consists of teams with similar strengths. The mode of group drawing makes a strength distribution in favor of these point distributions more improbable.
by Tobias Wolfanger