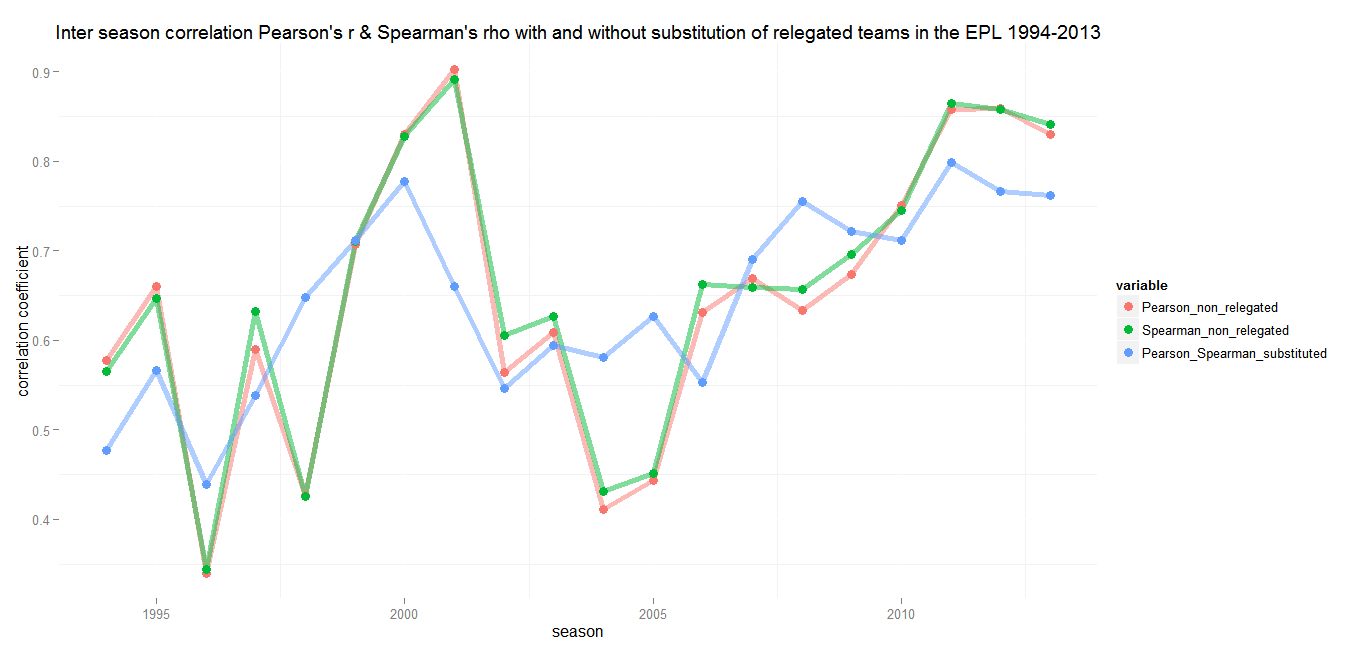
After a preceding post that showed that the trend in Europe’s top flights is going towards greater unequality regarding the share of wins, I decided to take a similar approach in analyzing the degree of revolution the European leagues experience from season to season. The most important column of a last matchday’s football league table is neither the number of points earned nor the number of scored and conceived goals. At the end, the only thing that matters is the final rank of a team. All important decisions for a team’s athletic and economic furture depend on its position in the table. Those at the bottom get relegated, the first teams can call themselves champions and the following teams at least have the great opportunity to participate in European competitions.
So what did I do? I collected the final tables of the last 50 seasons of the German, English, French, Italian and Spanish top leagues and calculated the correlation between the rankings of teams in two consecutive seasons. (Due to the fact that some teams get relegated each year, the calculated correlation is only valid for the selection of teams that were members of the league for two consecutive seasons.) Ranging from -1 to +1, the resulting coefficient Pearson’s r gives an impression how much movement a league has experienced over the course of one season. A perfect positive correlation of 1 means, that the order of teams in the final tables has been perfectly stable. Hence a team’s position in one season would have been a perfect predictor for next one. In contrast, a perfect negative correlation of -1 means, that the previous season’s table has turned upside down. Pearson’s rs around 0 indicate, that there is no connection between two seasons at all.
The two main expectations are, that there is a strong inter season correlation in team’s rankings over the whole examined period with increasing positive correlations in recent years. As we will see, the first holds true for all leagues. With the exception of two Bundesliga seasons in the late 1960s, only positive correlations can be found. The second hunch makes a deeper look necessary. It seems that not all leagues are moving in the same direction.
Bundesliga (Germany)
Min.: 0.03 – 1st Qu.: 0.49 – Median: 0.65 – Mean: 0.63 – 3rd Qu.: 0.78 – Max.: 0.87 – SD: 0.22
The Bundesliga is becoming more and more popular all across the football world. A big part of the growing admiration is due to its greater competitiveness compared to the English Premier league or La Liga. As the following graph depicts, two of the last three seasons have shown a remarkable extent of rotation in the league’s tables with only a slightly positive correlation. Imagine what this means: During both seasons Borussia Dortmund won the trophy, the table of the previous season wouldn’t have given you hardly any clue about the final ranking of teams. Maybe these two were rather exeptional ones, with the season 2012/13 returning to a level that is within the range of reasonable expectations which the seasons of the later 2000s set. So probably the last season with Bayern Munich raising the Meisterschale is an example of regression to the mean.
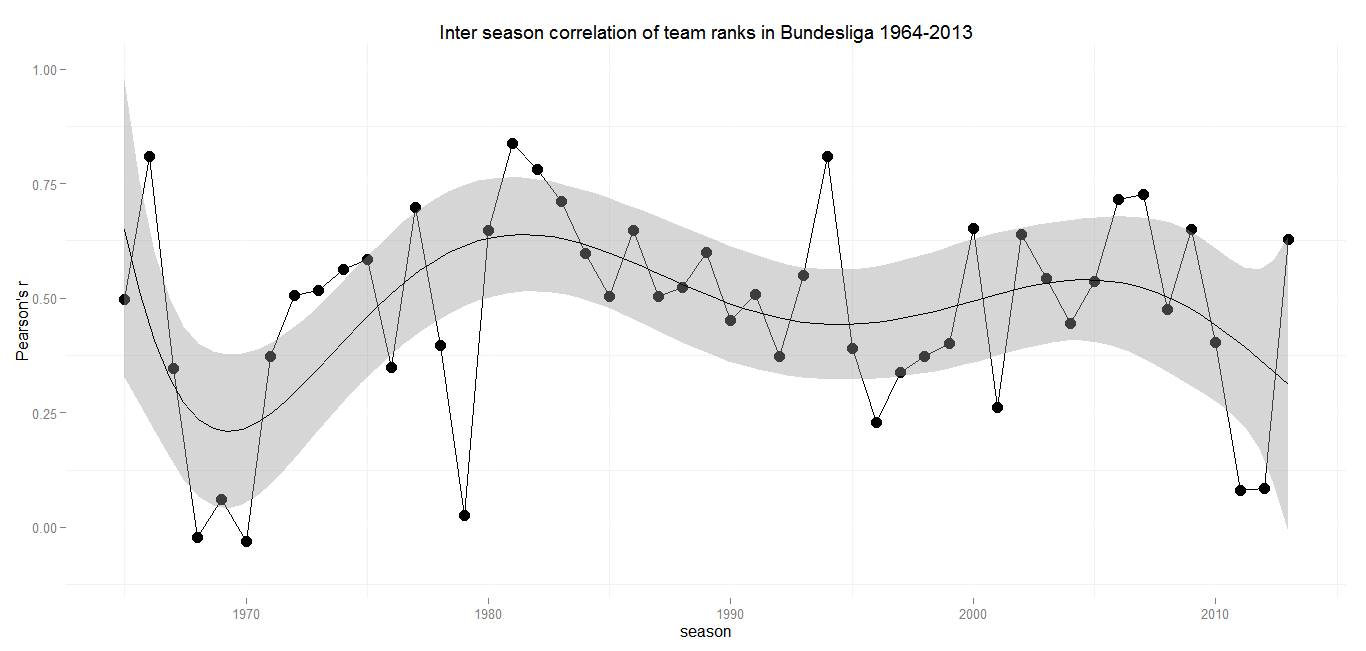
After the formation of the Bundesliga in the 1960s there have been some years with big movements in the final tables. But with the beginning of the 1970s the Bundesliga settled a a level of medium to strong correlation between the years. There are a few outliers over the course of 50 years, but in general the sixth degree polynomial I used to smooth the graph makes a pretty good fit.
The only season extremely out of range is 1978/79. A little online recherche might deliver an explanation for the vast revolution the Bundesliga experienced at this time: The winter 1978/79 was extremly strong, but a winter break wasn’t introduced until 1986. Heavy snowfall lead to the cancellation and postponement of not fewer than 46 matches. The lack of playable football fields caused that some clubs didn’t play at all for months from december to march. You can get an impression of the situation in this clip from the Sportschau. So the outside conditions might have had some effect on the final table. What surprises is, that the following season delivered a final table with a comparatively strong correlation to its exeptional predecessor, which suggests, that a relatively stable order of teams emerged from that season. This can have happened more or less by chance, but I’d be very glad if someone comes up with a better explanation.
The stable repetition of medium sized positive correlations until the recent years shows, that the Bundesliga always left some room for ascending teams. It will be interesting to see, if last season’s rather strong positive correlation is marking an upward trend, a regression to the mean or an outlier in a league that is becoming more competitive.
Premier League (England)
Min.: 0.23 – 1st Qu.: 0.45 – Median: 0.59 – Mean: 0.57 – 3rd Qu.: 0.67 – Max.: 0.90 – SD: 0.17
If you are looking for a football league that is hard to predict, you should probaly stay away from the English Premier League. Until the early 2000s the Premier League and its predecessors have delivered pretty constant medium to strong correlations. There were some ups and downs, but remarkably the weakest correlation in a period of 40 years is 0.23 in 1976/77. While other leagues had some extraordinary, almost revolutionary seasons, the First Division and Premier League tables always had a decent predictive power for the following season.
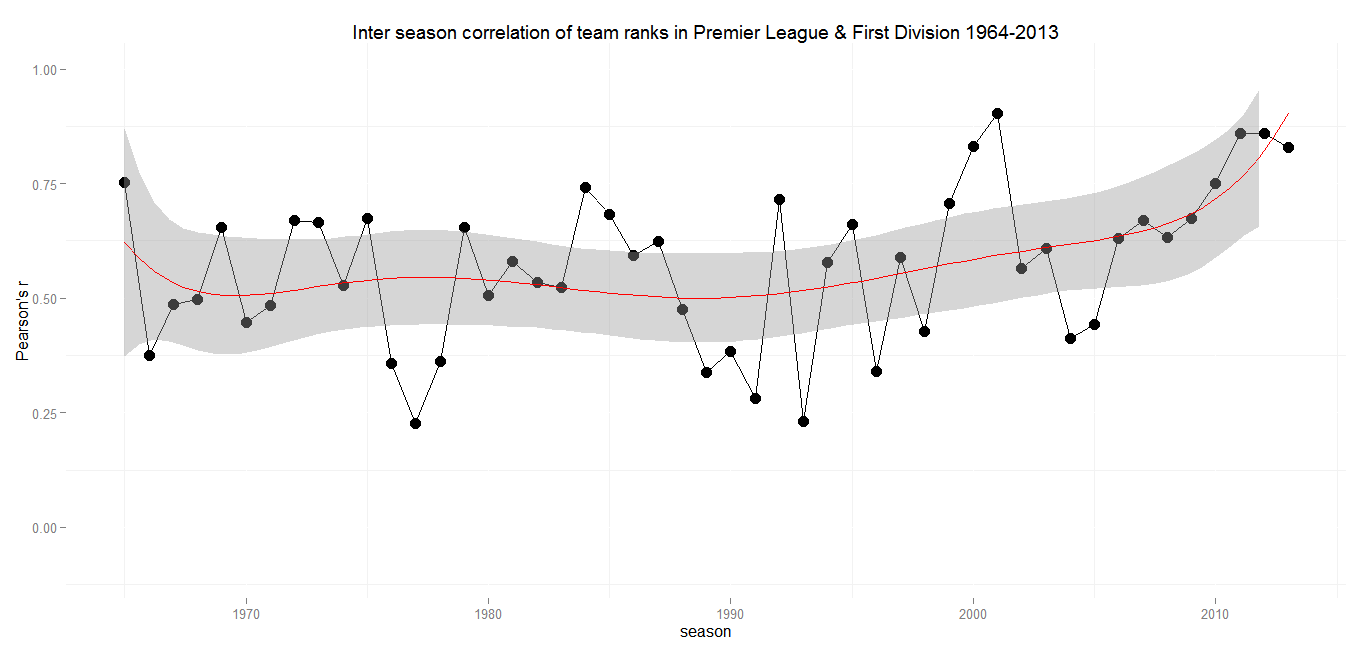
The late 1990s and the early 2000s saw a heavy increase in correlation, culminating in 2000/2001 (r = 0.90), where the final league table was almost an excact copy of the season before. Until 2004 the Premier League became more but not completely unpredictable again. Since then there has been an almost steady increase with almost no decline inbetween. That wouldn’t be as alarming, if there were any hints for an inverting trend somewhere in the future. But in contrast to seasons with strong positive correlations in the previous decades, the recent ones were not followed by a modest or sharp decline. The last three seasons each had a correlation above 0.8 with their forerunners. There is not much room for speculation how a team will perform in the upcoming season anymore.
Ligue 1 (France)
Min.: 0.05 – 1st Qu.: 0.29 – Median: 0.44 – Mean: 0.42 – 3rd Qu.: 0.52 – Max.: 0.82 – SD: 0.18
Like the Bundesliga, the French top flight seems to have gone through different phases, but it’s hard to detect patterns. The most remarkable thing about the League 1 and its predecessor División 1 is, that with r = 0.42 it has the lowest mean correlation of all European top leagues.

The last seasons have seen Pearson’s r at a moderate level. With the Ligue 1 rather a second tier league in European comparison, lets see what happens when the oligarch’s money keeps rolling in.
Serie A (Italy)
Min.: 0.03 – 1st Qu.: 0.49 – Median: 0.65 – Mean: 0.62 – 3rd Qu.: 0.78 – Max.: 0.87 – SD: 0.19
The overall trend of the Serie A league tables correlation resembles that of France, but on a much higher level, with a mean correlation of 0.62 and a first quantil at 0.49. That means that more than 75 percent of Serie A seasons have a higher inter season correlation than the average Ligue 1 or Bundesliga season. Serie A shows extremly stable correlations over the last 50 seasons, with the exeption of two years.
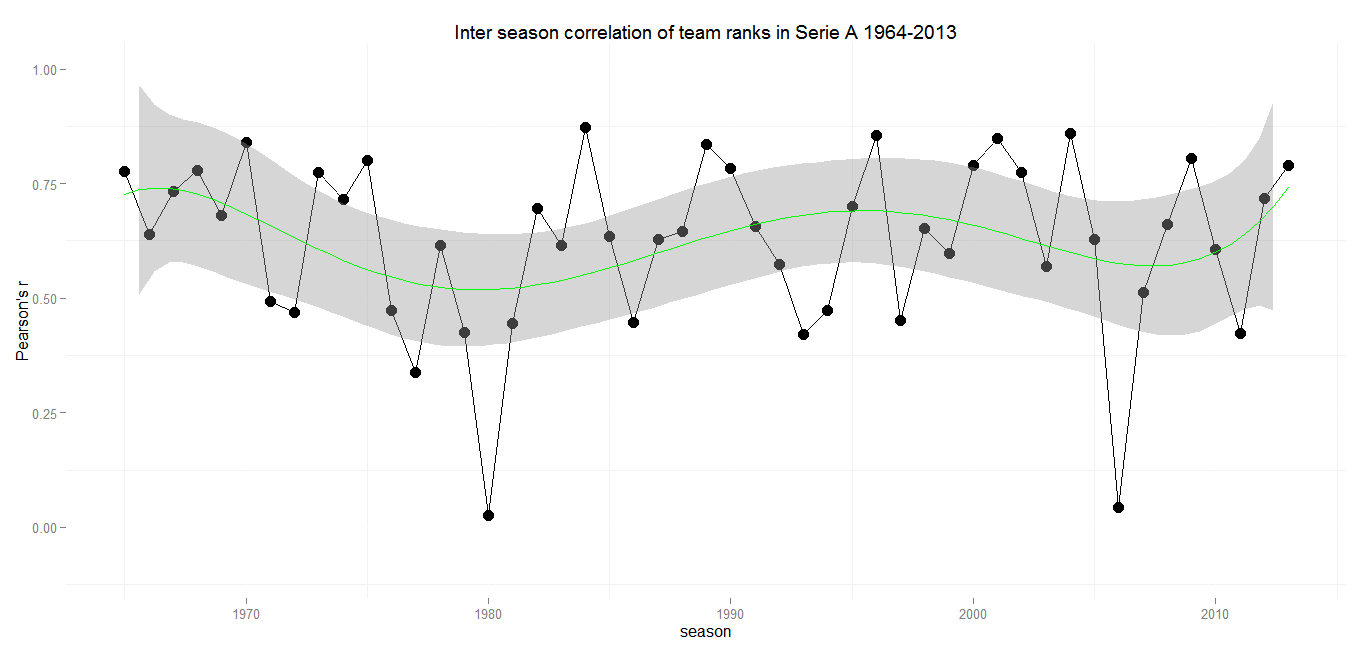
In an otherwise stable league environment both dents are explainable by match fixing scandals and the resulting punishments. The season of 1979/80 saw Milan and Lazio relegated to the Serie B due to the Totonero scandal. A few other teams were deducted five points in the following season without any bigger impact of the final classement.
The dent in 2005/2006 is owed to another sad episode of Italian football. The punishment for the fixing of matches lead to the relegation of Juventus FC and the deducement of points for Milan, Lazio and Fiorentina with an enourmous impact on the final table. The sentence included deducement of points for the latter ones and Reggina in the following season as well, but the league returned to a regular level of inter season correlation.
Justitia seems to be the only one to ramble up the Serie A. But there is also a good thing to say about Italian Football: They had a strong regular correlation between seasons even before the big commercial times in football began. If it wasn’t for the scandals, the trend would almost be a straight line, like in Spain.
Primere División (Spain)
Min.: 0.34 – 1st Qu.: 0.49 – Median: 0.60 – Mean: 0.60 – 3rd Qu.: 0.67 – Max.: 0.91 – SD: 0.13
If there hadn’t been the Serie A scandals, Spains top flight would have been the one with the strongest average inter season correlation (0.60). With an incredible r of 0.91 in 1994/95 and 0.34 in 1987/88 La Liga holds the record for the highest maximun and minimum values. It also has by far the smallest standard deviation over the last 50 seasons.
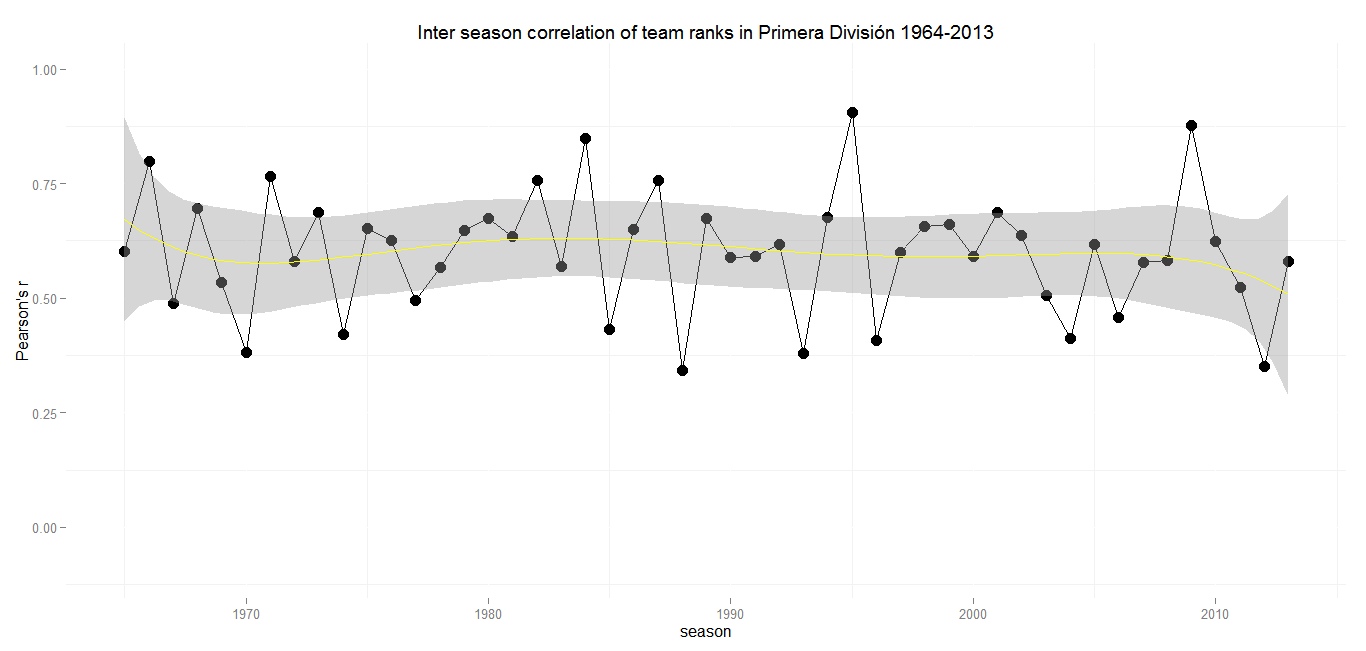
Despite only two teams competing for the trophy every year, there obviously is at least some room left for the ascent and decent of other teams. Currently at least more than in Italy or England. If there is this often complained about lack of competiveness, it is to seek at the top of the league.
Conclusions and future expectations
A mere look at the inter season correlation presents the picture of La Liga and Serie A conducting as they have done for the last half century and probably will in the future, with medium to strong correlations each year. It’s harder to make predictions for Bundesliga and Ligue 1. Bundesliga’s downward trend with regards to the correlation of club rankings in recent years is due to two extraodinary seasons in the last three years. The current season might give us a clue in which direction it will develop. For the traditionally volatile Ligue 1, an important factor could be the amount of money that flows into the system and whether it will only be targeted at two clubs.
Here lies a weekness of the approach undertaken in this post. The correlation of a league’s two conscecutive seasons may give us an idea how much movement can be expected from year to year, but doesn’t tell much about in which areas of the table there is the most rotation. Because it does’t take into account the point difference between two neighbouring teams, it gives us little insight how close the race for the national title has been.
As the Spanish example shows, inter season correlation can’t express what’s happening at the top. It doesn’t show that the only two serious contenders for the title are Barcelona and Real Madrid. The situation in the Premier League is different. With both Manchester clubs, the London sides Chelsea, Arsenal and Tottenham and Liverpool having nested themselves in a comfortable way at the top of the league, there is not much room left for surprise teams or rotation at all. But on the other hand there are more than just two teams with at least resonable odds for a bet on them winning the championship. The question is, which option is more attractive for observers of a football league. A very stable league with more contest at the top but not much movement at all or another one with an extremely stable top but some competition from the third rank downwards.
Please feel free to tell me your opinion in the comments section or contact me on Twitter.
by Tobias Wolfanger
Gefällt mir:
Gefällt mir Lade...

