I’m happy that I gained a lot of positive feedback for my last post about the inter season correlation as a measure for the stability of football leagues. However, there were also two points of critique, which I want to address in this post, as I thought about both of them before and use them as an incentive to think about the future use and possible improvements of inter season correlation.
r² as a measure of predictability
The first point of critique I was confronted with at reddit is, that Pearson’s r would be a meaningless measure if not adjusted for r². That’s not true. If the argument of predictability is brought into play, as I did, it’s correct that r² is the adequate expression which share of variance can be explained by a correlation. It’s pretty easy to calculate by just squaring r, so it’s hard to see why r should be meanigless. But I admit that for the comparison of predictability of leagues I should have argued with r². The reason I didn’t use it is due to the fact, that I was aware that there might be negative inter season correlations, as they showed up in two early Bundesliga seasons. These would have been invisible otherwise.
Substituting relegated by promoted teams
The second point of critique was, that I didn’t include relegated teams in the calculation of inter season correlation. I must admit that the main factor I did this was lazyness. As you can imagine, it is a hell lot of work to adjust the database for 245 inter season correlations (5 leagues x 50 years). I gathered the data from a few web sources and after correcting some name changes over the course of years, remarkably many of Italian, French and Spanish teams varied their official name over the last 50 years while the English and German teams kept theirs, I used pivot tables to build my database, with team names in rows and seasons in columns. All matching of relegated and promoted teams is handwork as I haven’t found a way to automate this yet. So the exact way to interpret the inter season correlation as presented in the previous post is the Pearson correlation of the rank of teams which didn’t get relegated in the first of the two seasons.
Spearman or Pearson
Another way to calculate correlations is to use Spearman’s rho instead of Pearson’s r. Spearman has the advantage of being applicable to ordinal data by using ranks instead of metric data. In the case of team ranks of a league’s final table that doesn’t make much of a difference, because ranking ranks will not have much of an effect. Spearman’s rho as a measure of inter season correlation can be interpreted as the correlation of ranks in the order of teams which didn’t get relegated in the first of the two seasons. The small differerence lies in the effect that promoted teams splitting up the phalanx of non relegated teams can have on Pearson’s r, by influencing the mean value, but not on Spearman’s rho.
Comparing the measures
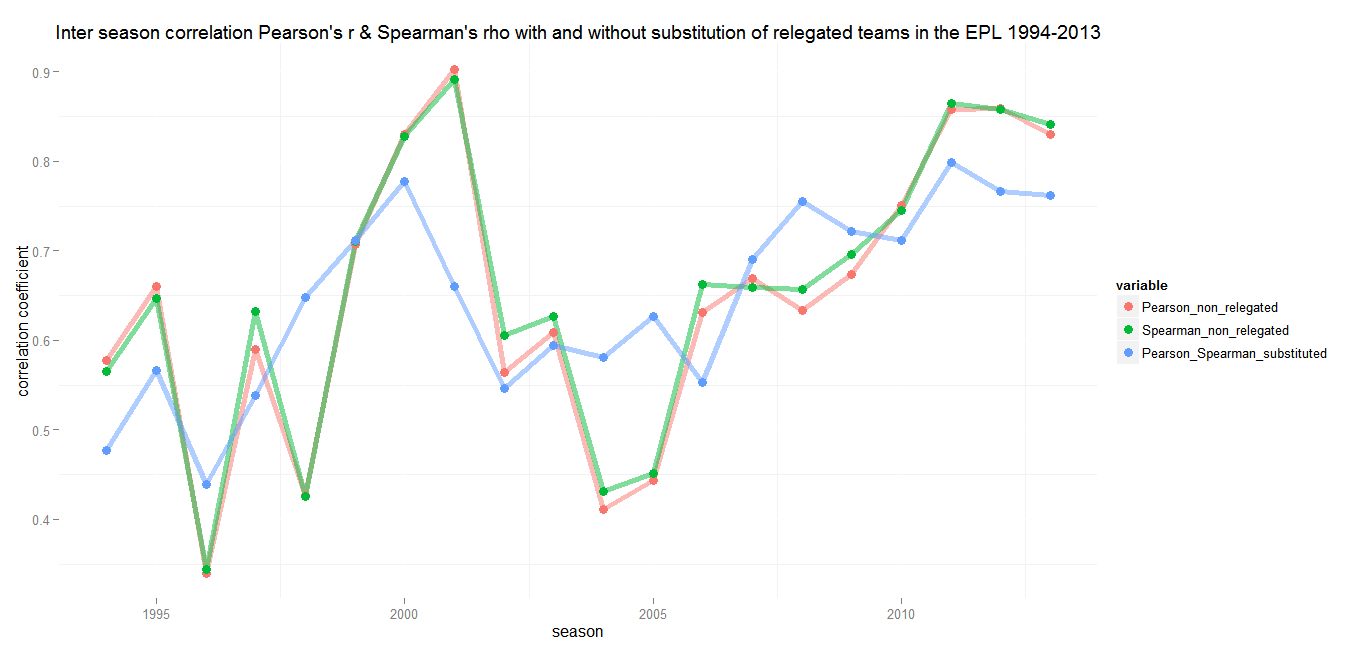
In the following graph I plotted different variations of the inter season correlation for the last 20 Premier League seasons. Not surprisingly there are only minimal differences between Pearson’s r and Spearman’s rho, so it’s more or less irrelevant which one is chosen. But have a look at the correlation coefficients for the case that relegated and promoted teams get matched. (Because all teams are included there is no difference between r and rho anymore.)
It seems that it could be worth the effort of doing some handwork. While the coefficients only based on the non relegated teams over the course of 20 seasons have coefficients of variation of 0.25 for Pearson and 0.24 for Spearman, the inclusion of all teams leads to a value of 0.16. The result is a smoother line with much smaller changes from season to season.
Conclusion
Including all teams by replacing relegated with promoted teams seems to be a good idea, but it is a lot of work. Looking at shorter period of time the effort is definetely worth it, but the effect on the overall trend is rather small. All measures suggest that the inter season correlation of the last Premier League seasons have been on an incredibly high level. Including all teams, the correlation coefficient between 2011/12 and 2012/13 is 0.76 with r² = 0.58. That means that 58 percent of the variance of the 2012/13 table can be explained by the order of the 2011/12 table.
by Tobias Wolfanger


